Learn about air quality in the San Luis Valley
Background on particulate matter, local sources and health, how air quality is measured, and ways to reduce exposure when particle levels rise.
What is particulate matter?
Particulate matter, or PM, is a mixture of tiny solid particles and liquid droplets floating in the air. Particles are grouped by size. PM10 refers to particles 10 micrometers or smaller; PM2.5 refers to particles 2.5 micrometers or smaller.
Size matters. Smaller particles can travel farther into the respiratory system. Fine particles can reach deep into the lungs, while ultrafine particles may move beyond the lungs into the body.
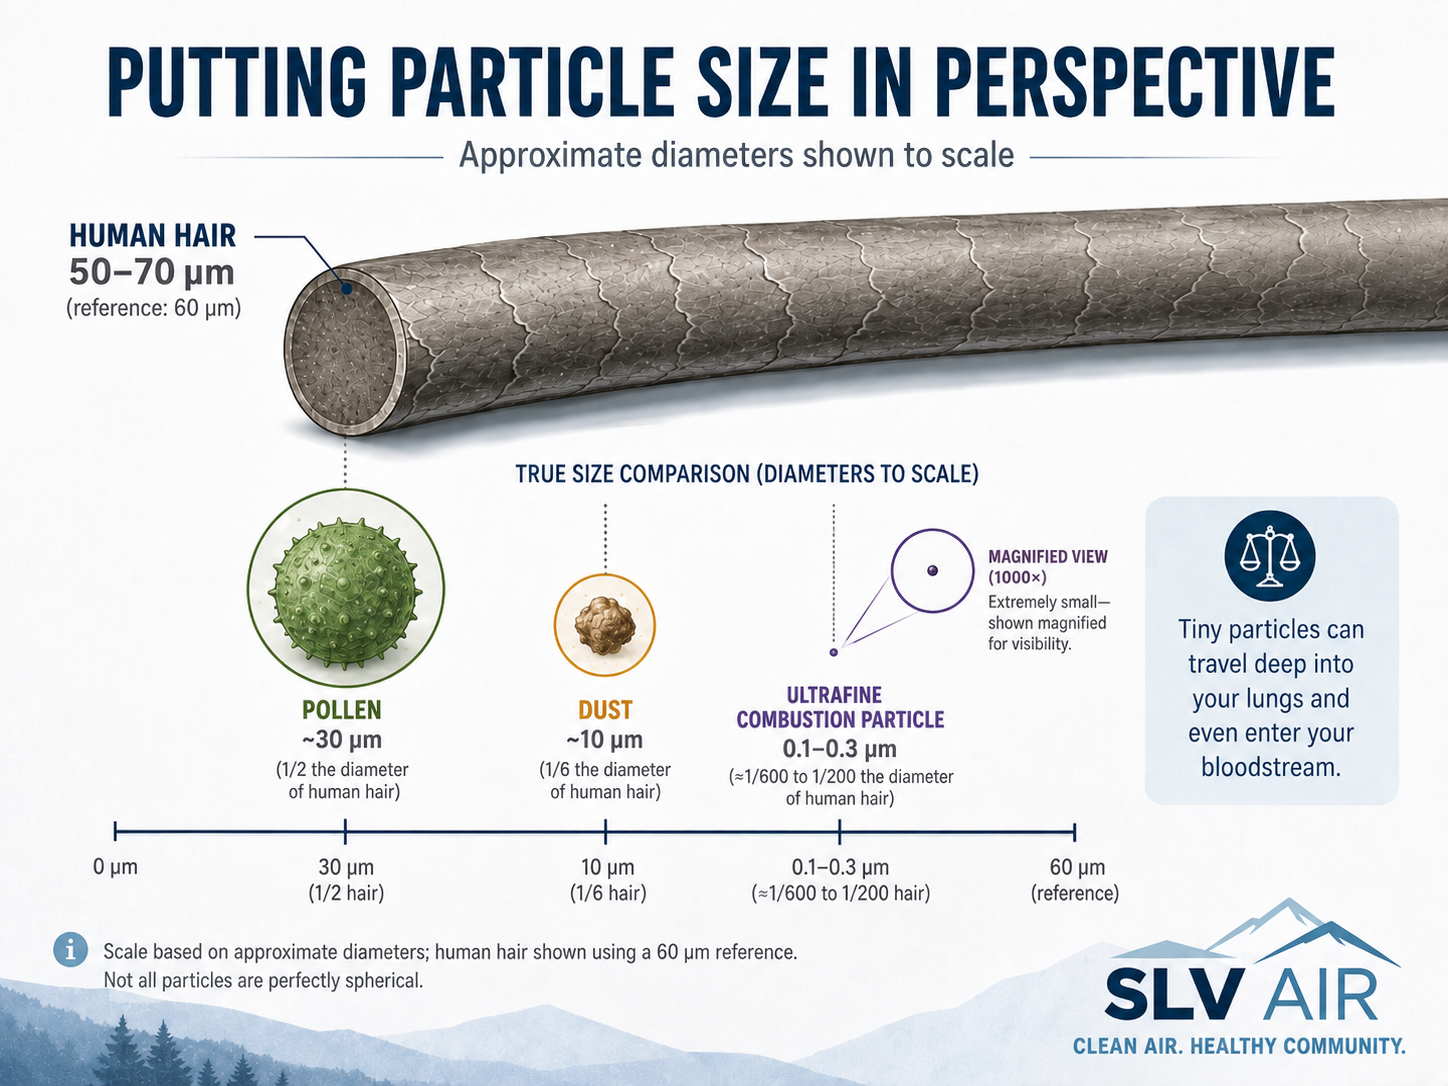
Same particle mass, very different particle populations
The example below holds total particle mass constant. As particle diameter decreases, the same mass can contain many more individual particles and much more total particle surface area.
| Equal-mass example | 10 µm Coarse |
2.5 µm Fine |
0.1 µm Ultrafine |
|---|---|---|---|
| What that mass looks like | |||
| Total mass | 1relative unit | 1relative unit | 1relative unit |
| Particle number | 1 | 64 | 1,000,000 |
| Surface area per particle | 1 | 0.0625 | 0.0001 |
| Total surface area per mass | 1 | 4 | 100 |
| Where particles can reach | More likely to be filtered in the upper or proximal airway. | Can reach the peripheral airways and deep lung. | Very small particles may enter systemic circulation and can carry more material on their total surface area. |
Why monitor particles across the Valley?
Air quality can vary from place to place and hour to hour. A Valley-wide network gives residents and communities localized measurements that can help identify periods or areas with higher particulate matter and support decisions about outdoor activity.
Local research connects dust and high PM with respiratory health-care use
A study conducted in the San Luis Valley found increases in walk-in visits, emergency visits, and hospitalizations for respiratory conditions when dust storms occurred and PM levels were elevated. The estimated increase in urgent health-care use and hospitalization ranged from 17–66%, depending on PM severity over the previous 2–3 days.
James KA, Strand M, Hamer MK, Cicutto L. Health Services Utilization in Asthma Exacerbations and PM10 Levels in Rural Colorado. Ann Am Thorac Soc. 2018;15(8):947–954. doi:10.1513/AnnalsATS.201804-273OC.
What can high PM levels do?
High particulate matter exposure can cause stress and inflammation throughout the body. Effects may include eye, nose, and lung irritation, coughing, difficulty breathing, asthma and COPD attacks, reduced lung capacity, irregular heartbeats, non-fatal heart attacks, and increased risk for people with lung and heart conditions.
Particles can also affect animals and sensitive vegetation, and can settle into lakes, streams, reservoirs, and wells.
Outdoor air pollution can also include gases such as ozone, sulfur dioxide, and nitrogen dioxide. Pollution may be visible as smoke, haze, or dust, but it can also be invisible and odorless.
Where does particulate matter come from?
Particles can come directly from smoke, burning, and dust, or from activities that disturb soil and other materials.

Traffic & fuel combustion
Cars, trucks, buses, motorcycles, and gas-powered equipment.
Wildfires
Wildfire smoke contains fine particles and gases and can travel long distances.
Heating & cooking
Wood, coal, and other fuel-burning stoves.
Windblown dust
Wind can lift soil, road dirt, dust, and sand into the air.
Soil disturbance
Construction and other activities that move soil, dirt, or sand.
Other local sources
Agriculture, industry, smoke, traffic, and natural sources can all contribute.
How does the SLV Air network measure PM?
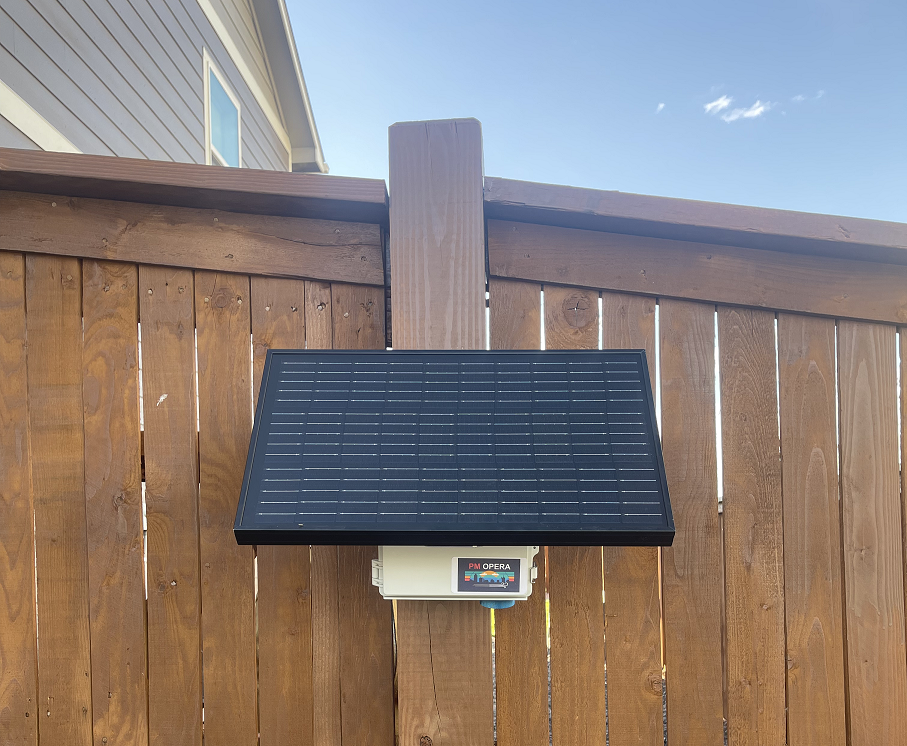
The network uses different types of equipment to balance measurement quality with coverage across the Valley. Lower-cost community sensors make it possible to place more monitors in communities, while regulatory monitors provide reference-quality measurements that can be used to check and calibrate lower-cost sensors.
Regulatory instruments can cost roughly 10 to 500 times more than lower-cost monitors. Weather stations are included because wind, temperature, humidity, and inversions can change how particles move and whether pollution spreads out or remains near the ground.
Measurements come from equipment in the community
The markers on the map represent instruments operating at real sites around the Valley. Community monitoring expands local coverage, while reference and regulatory measurements help support data quality and interpretation.
That combination is important in a large rural region where conditions can differ substantially from one community to another.
Regulatory monitors
High-quality instruments operated under strict requirements and used for official air-quality decisions and long-term trends.
Community sensors
Lower-cost devices that provide useful local information and help show patterns across space and time.
Weather stations
Wind, temperature, humidity, and inversions help explain changing particle conditions.
Forecasts & advisories
Measurements, weather, and models can be used together to help people plan ahead.
If PM levels are higher, what can I do?
Use the current local conditions together with your own health needs. People at higher risk should work with a health-care provider to understand how air pollution affects them and what management steps are appropriate.
- Learn the AQI colors. Know what the categories mean and whether you or someone in your household is at increased risk.
- Look before you go. Check local conditions regularly, especially during wildfire smoke, high winds, dust storms, or stagnant weather.
- Adjust activity. Reduce strenuous outdoor activity when particle levels are high; heavier breathing increases the amount of air and pollution you take in.
- Decrease time outside. Less time in polluted outdoor air generally means less exposure.
- Close up during events. During wildfire smoke, wind, or dust events, keep doors and windows closed. In vehicles, use recirculate mode.
- Filter indoor air. Portable HEPA air cleaners or appropriately built low-cost DIY air cleaners can reduce particles indoors.
- Consider an N95. If you must be outside during high particle levels, a well-fitting N95 respirator can reduce inhaled particles when used correctly.
- Reduce pollution you create. When air quality is already poor, avoid unnecessary smoke-producing or dust-generating activities when possible.
PM tells us how much particle mass is present — not everything the particles contain
Dust can be made up of, or carry, many different materials. Additional sampling and laboratory analysis may be needed to learn what those particles contain.
How do you know what's on the dust?
Some monitors draw a known volume of outdoor air through a filter that collects particles. The filter can be weighed to quantify particle mass and retained for later analysis of what the dust contains.
Ready to use the measurements?
The Guide explains how to read AQI colors, use the map controls, understand monitor markers, and interpret the current-value gauges and history charts.